and  ,
we describe a numerical method that gives the probability that finds a
solution at least as good as a given target value in a smaller computation
time than , for the case where the runtimes of each of the two algorithms
follow any runtime distribution.
An illustrative example of a numerical application is also reported.
We describe the perl program tttplots-compare, developed to compare
time-to-target plots or general runtime distribution for measured CPU times of
any two heuristics based on stochastic local search.
The perl program can be downloaded in Section 4 or from
http://www.ic.uff.br/
,
we describe a numerical method that gives the probability that finds a
solution at least as good as a given target value in a smaller computation
time than , for the case where the runtimes of each of the two algorithms
follow any runtime distribution.
An illustrative example of a numerical application is also reported.
We describe the perl program tttplots-compare, developed to compare
time-to-target plots or general runtime distribution for measured CPU times of
any two heuristics based on stochastic local search.
The perl program can be downloaded in Section 4 or from
http://www.ic.uff.br/ celso/tttplots/tttplots-compare.gz.
1) Motivation
Runtime distributions or time-to-target plots display on the ordinate axis
the probability that an algorithm will
find a solution at least as good as a given target value within a given
running time, shown on the abscissa axis.
Time-to-target plots were first used by Feo et al. [7].
Runtime distributions have been advocated also by
Hoos and Stützle [8,9] as a way to characterize
the running times of stochastic algorithms for combinatorial
optimization.
Aiex et al. [2] described a perl program to create time-to-target plots for measured times that are assumed to fit a shifted exponential distribution, following closely [1]. Such plots are very useful in the comparison of different algorithms or strategies for solving a given problem and have been widely used as a tool for algorithm design and comparison.
In this work, we explore runtime distributions to evaluate
stochastic local search algorithms and we describe a new tool to compare
any pair of different stochastic local search algorithms  and
and  .
In Section 2, we describe a numerical method originally
presented by Ribeiro et al. [14,15]
that gives the probability that algorithm finds a
solution at least as good as a given target value in a smaller computation
time than , for the case where the runtimes of the two algorithms follow
any general runtime distribution.
A detailed numerical application is reported in Section 3,
illustrating the comparison of two different sequential algorithms.
This is followed in Section 4 by the description of the perl program tttplots-compare, whose source code
may be downloaded from http://www.ic.uff.br/celso/tttplots/tttplots-compare.gz.
Concluding remarks are made in the last section.
.
In Section 2, we describe a numerical method originally
presented by Ribeiro et al. [14,15]
that gives the probability that algorithm finds a
solution at least as good as a given target value in a smaller computation
time than , for the case where the runtimes of the two algorithms follow
any general runtime distribution.
A detailed numerical application is reported in Section 3,
illustrating the comparison of two different sequential algorithms.
This is followed in Section 4 by the description of the perl program tttplots-compare, whose source code
may be downloaded from http://www.ic.uff.br/celso/tttplots/tttplots-compare.gz.
Concluding remarks are made in the last section.
We assume the existence of two stochastic local search algorithms
2) General run time distributions
and for the approximate solution of some combinatorial optimization problem.
We denote by
(resp. ) the continuous random variable representing the time needed
by algorithm (resp. ) to find a solution as good as a given target value.
Let  and
and  (resp.
  and
and  ) be the
cumulative probability distribution and the probability density function of (resp. ), respectively. Then,
) be the
cumulative probability distribution and the probability density function of (resp. ), respectively. Then,

since
 for any for any
  .
For an arbitrary small real number
.
For an arbitrary small real number  ,
the above expression
can be rewritten as
,
the above expression
can be rewritten as
Since
 for
for
 , replacing
 by
by
 and by
 in (1) leads to

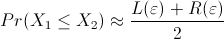
 and
and
 be the value of the left and right hand sides
of the above expression, respectively, with
be the value of the left and right hand sides
of the above expression, respectively, with
 being the difference between the upper and lower bounds of
 .
Then,
.
Then,
 . Since
 for
for  ,
expression (2) turns out to be
,
expression (2) turns out to be
 between the upper and lower bounds of
(or the absolute error in the integration)
is smaller than or equal to
between the upper and lower bounds of
(or the absolute error in the integration)
is smaller than or equal to
 .
Therefore, this difference can be made as small as desired by choosing a sufficiently small value for .
.
Therefore, this difference can be made as small as desired by choosing a sufficiently small value for .
In order to
numerically
evaluate a good approximation to
,
we select the appropriate value of such that
the resulting approximation error
is sufficiently small.
Next, we compute
and
to obtain the approximation
In practice, the probability distributions are unknown.
Instead of them,
all information available is a sufficiently large number  (resp.
  ) of observations of the random variable (resp. ).
Since
the value of
is
also
unknown
beforehand,
the
appropriate
value of cannot be estimated.
Then, we proceed iteratively as follows.
) of observations of the random variable (resp. ).
Since
the value of
is
also
unknown
beforehand,
the
appropriate
value of cannot be estimated.
Then, we proceed iteratively as follows.
Let  (resp.
  ) be the value of the
  -th smallest observation of
the random variable (resp. ), for
-th smallest observation of
the random variable (resp. ), for
 (resp. ).
We set the bounds
(resp. ).
We set the bounds
 and
and
 and choose an arbitrary
number
and choose an arbitrary
number  of integration intervals to compute an initial value
 for each integration interval.
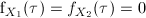
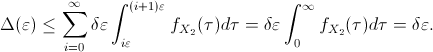
For sufficiently small values of
the integration interval
,
the
probability density function in the interval
for each integration interval.
For sufficiently small values of
the integration interval
,
the
probability density function in the interval
![$[i\varepsilon,(i+1)\varepsilon]$](img43.png) can be approximated by
can be approximated by
 ,
where
,
where
.
Finally, the value of
can be computed as in
expression
(4),
using the estimates
 and
and
 in the computation of
and
. If the approximation error
is sufficiently small, then the procedure stops. Otherwise, the value of is halved
and the above steps are repeated
until convergence.
in the computation of
and
. If the approximation error
is sufficiently small, then the procedure stops. Otherwise, the value of is halved
and the above steps are repeated
until convergence.
We illustrate the application of the tool described in the previous
section with the comparison of two stochastic local search algorithms
(running on the same instance) for the routing and wavelength assignment
problem. The first is a multistart procedure, while the second is a
tabu search heuristic.
A point-to-point connection between two endnodes of an optical network is called a lightpath.
Two lightpaths may use the same wavelength, provided they do not share any common link.
The routing and wavelength assignment problem is that of routing a set of lightpaths and assigning a wavelength to each of them,
minimizing the number of wavelengths needed. Noronha and Ribeiro [13] proposed a decomposition heuristic for
solving this problem. First, a set of possible routes is precomputed for each lightpath.
Next, one of the precomputed routes and a wavelength are assigned to each lightpath
by a tabu search heuristic solving an instance of the partition coloring problem.
We compare this decomposition strategy based on the tabu search heuristic
with the multistart greedy heuristic of Manohar et al. [12].
Two networks are used for benchmarking. The first has 27 nodes representing the
capital cities in Brazil, with 70 links connecting them. There are 702 lightpaths to be routed.
Instance [10] Finland is formed by 31 nodes and 51 links,
with 930 lightpaths to be routed.
Each algorithm was run 200 times with different seeds. The target was set at 24 (the best known solution value is 24)
for instance Brazil and at 50 (the best known solution value is 47) for instance Finland.
Algorithm
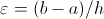
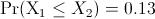
The empirical run time distributions of the decomposition and multistart strategies
are superimposed in Figure 1. The direct comparison
of the two approaches shows that decomposition clearly outperformed the multistart
strategy for instance Brazil, since
We have investigated the convergence of the proposed measure with the sample size
(i.e., with the number of independent runs of each algorithm). Convergence with the sample size
is illustrated next for the Finland instance of the routing and wavelength assignment problem,
with the target set at 49. Once again, algorithm
The perl program tttplots-compare takes two input files with
The perl source code of program tttplots.compare is available for download by clicking
here.
To run this program, simply type: perl ttttplots-compare -f input-filename1 input-filename2, where input-filename1.dat and input-filename2.dat
are the input data files with
Run time distributions are very useful tools to characterize
the running times of stochastic algorithms for combinatorial optimization.
In this work, we extended a previous tool developed for plotting and evaluating run time
distributions [1], providing a perl program that establishes pairwise comparisons of stochastic local heuristics for combinatorial optimization problems by computing the probability that one heuristic is faster than the other.
This new tool and the resulting probability index revealed themselves as very
useful and promising, providing a new, additional measure for comparing the performance
of stochastic local search algorithms or different versions of the same algorithm.
They can also be used for setting the best parameters of a given algorithm,
by providing an strategy for comparing the resulting implementations.
In addition to the first applications reported in [14,15], the perl program described and made available in this paper has already been used in the comparison of evolutionary and genetic algorithms to the
3) Illustrative example
is the multistart heuristic, while is the tabu search decomposition scheme.
 in this case
(with
in this case
(with
 ,
,
 ,
,
 , and
, and
 ).
However, the situation changes for instance Finland. Although both algorithms have
similar performances, multistart is slightly better with respect to the measure proposed
in this work, since
).
However, the situation changes for instance Finland. Although both algorithms have
similar performances, multistart is slightly better with respect to the measure proposed
in this work, since
 (with
(with
 ,
,
 ,
,
 , and
, and
 ).
).
, and (b)
.
![\includegraphics[width=11cm, angle=0]{gpr-gedpXts-brasil.eps}](img62.png)
(a) Brazil instance with target 24
![\includegraphics[width=11cm, angle=0]{gpr-gedpXts-fin.eps}](img63.png)
(b) Finland instance with target 50
is the multistart heuristic and algorithm is the tabu search decomposition scheme.
The estimation of
is computed for N = 100, 200, 300, 400, 500, 600, 700, 800, 900, 1000, 2000, 3000, 4000, and 5000
independent runs of each algorithm.
Figure 2 displays the results obtained.
We notice that the estimation of
stabilizes as the sample size  increases.
with the sample size for the Finland instance of the routing and wavelength assignment problem.
![\includegraphics[width=10cm, angle=0]{fin-100-5000.eps}](img65.png)
4) The perl program: tttplots-compare
lines each, where denotes the number of runs of each algorithm and . Each line contains a running time entry.
The program calculates the probability that the first algorithm finds a solution at least as good as an originally given target value in a smaller computation time than .
running time data points in each of them.
5) Concluding remarks
 -interconnected multi-depot multi-traveling salesmen problem, to the winner determination problem in combinatorial auctions, to the general-cost set covering problem, to the Steiner triple covering problem, to the general-cost set -covering by pairs problem, see e.g. Andrade et al. [3,4,11]. It was also used in comparisons of stochastic local search algorithms for the 2-path network design problem [5] and for the antibandwidth problem [6].
Acknowledgments.
This paper provides the perl program whose fundamentals and numerical computations have been originally proposed in the paper titled
``On the use of run time distributions to evaluate and compare sequential and parallel stochastic local search algorithms'' [14],
which received the ``Best Paper Presentation Award'' among all papers presented at the
conference ``Engineering Stochastic Local Search Algorithms'' held in
Brussels from September 3 to 4, 2009.
Bibliography

![\begin{displaymath}
\Delta(\varepsilon)=\sum_{i = 0}^{\infty}
\left[F_{X_1}((i+1...
...ght]
\int_{i\varepsilon}^{(i+1)\varepsilon}f_{X_2}(\tau)d\tau.
\end{displaymath}](img24.png)